Analytics
Track and analyze scan activity for your dynamic QR codes.
Analytics are only available for dynamic QR codes. Static QR codes cannot be tracked.
Analytics Overview
Access the Analytics Overview from your dashboard to see account-wide scan activity. The overview provides:
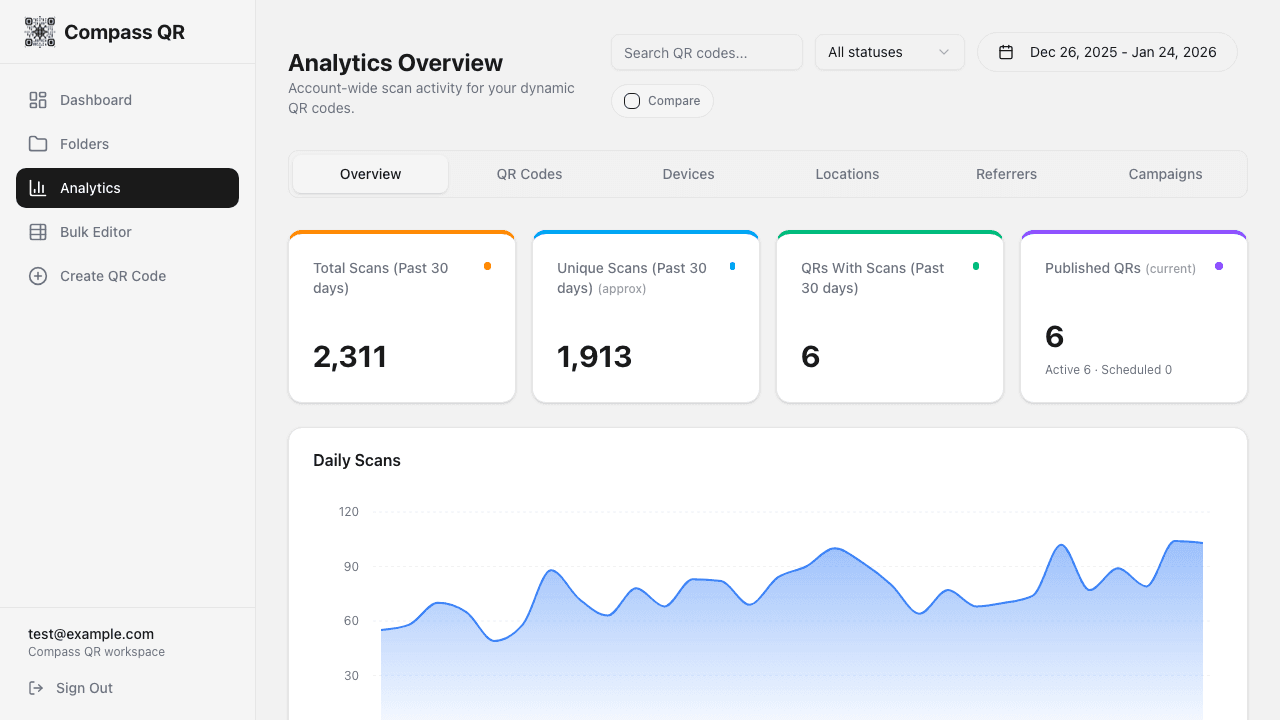
Key Metrics
Total Scans
Total number of times your QR codes were scanned
Unique Scans
Approximate unique visitors (deduplicated by IP/device)
QRs With Scans
Number of QR codes that received at least one scan
Published QRs
Active and scheduled dynamic QR codes
Daily Scans Chart
Visualize scan trends over time with the daily scans area chart. The chart shows:
- Total scans per day (filled area)
- Unique scans per day (line)
- Previous period comparison (when enabled)
Filters and Date Range
Date Range Picker
Select custom date ranges to analyze specific periods:
- Last 7 days
- Last 30 days
- Last 90 days
- Custom date range
Compare Periods
Enable Compare to see how your current period compares to the previous equivalent period. This shows:
- Percentage change in total scans
- Percentage change in unique scans
- Previous period line on the chart
Status Filter
Filter analytics by QR code status:
- All - Include all QR codes
- Active - Currently live QR codes
- Scheduled - Waiting to become active
- Expired - Past their expiration date
- Inactive - Manually disabled
Search
Search for specific QR codes by name to filter the analytics.
Breakdown Reports
Top QR Codes
See which QR codes receive the most scans, with percentage of total traffic.
Device Breakdown
Understand what devices your audience uses:
- iOS - iPhones and iPads
- Android - Android phones and tablets
- Desktop - Computers (usually clicking shared links)
- Other - Unknown or other devices
Top Countries
Geographic distribution of your scans by country, based on IP geolocation.
Top Referrers
Where your traffic is coming from (direct scans show as "Direct/QR Scan").
Campaign Analytics (UTM)
If you've added UTM parameters to your QR codes, you can analyze campaign performance:
- UTM Source - Traffic sources (google, newsletter, etc.)
- UTM Medium - Marketing medium (cpc, email, social)
- UTM Campaign - Campaign names
Use consistent UTM naming conventions across campaigns for easier analysis.
Individual QR Analytics
Click on any QR code in your dashboard or the analytics overview to see detailed stats for that specific code, including:
- Scan timeline
- Device breakdown
- Geographic data
- Hourly/daily patterns
- A/B test variant performance
- Conversion tracking results
Analytics Tabs
The analytics page includes multiple tabs for different views:
- Overview - Summary with all key metrics and charts
- QR Codes - List of QR codes with performance data
- Devices - Detailed device analytics
- Locations - Geographic breakdown
- Referrers - Traffic source analysis
- Campaigns - UTM parameter analysis